Polygon-based Socio-economic data analysis and display
Objectives:
Investigate how well the MetroStar and Orbiter bus routes serve potential University of
Canterbury (UC) students aged 15 - 24 using different areal units.
Investigate how well the MetroStar and Orbiter bus routes serve potential University of
Canterbury (UC) students aged 15 - 24 using different areal units.
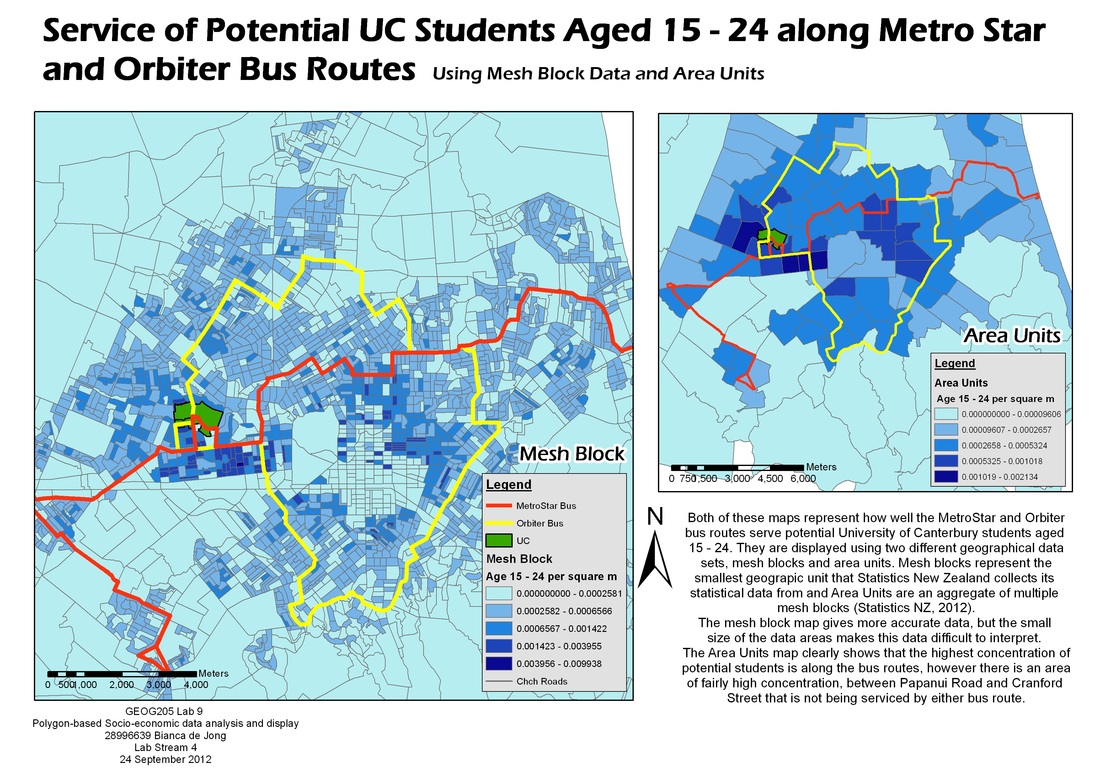
Figure 1
Extracting, cleaning, and joining tabular data for use in ArcGIS
Using tabular data from the Statistics New Zealand Census 2006, I am able to extract specific information such as certain age groups, and change the headings it so it is compatible to be joined with ArcGIS. The cleaned data needs to be joined to its geography in ArcMap inorder for it to be used for analysis. (fig. 2)
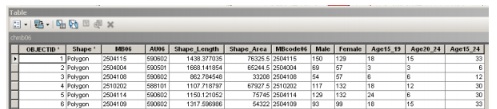
Figure 2: Joined census and geographical data
Dissolve Tool
As the census geographies fit within each other, to produce aggregated data sets of the same information I am able to dissolve the meshblock information together using the dissolve tool, this saves time and means that I do not have to go through the extraction, cleaning and joining process a second time. Dissolving removes the boundaries between common areas identified by an attribute and summarises numeric attributes.
The Modifiable Areal Unit Problem (MAUP)
The Modifiable Areal Unit Problem (MAUP) occurs during the spatial analysis of aggregated data. It arises when essentially the same data produces different results when differing forms of aggregation are applied.
Figure 1 displays scale effect MAUP, where the same analysis is effected by differing scales and exhibits different results (esri, 2012).
Figure 1 displays scale effect MAUP, where the same analysis is effected by differing scales and exhibits different results (esri, 2012).
