ImageJ
Writing and Computing Macros
I am able to take extracts from different bands of a land sat image and write a macro that computes an index from two images.
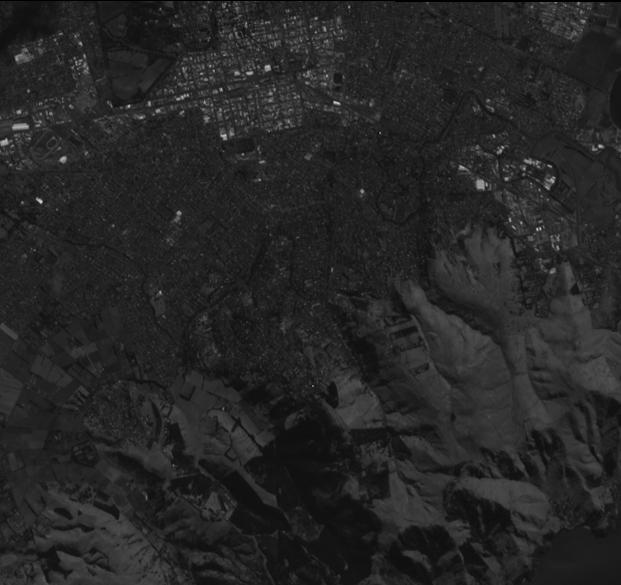
Remotely sensed images give reflectivity data, encoded as integer values from 0-255. This data can be used for areal classification, such as analysis of vegetation cover by measuring the ratios of different bands (Chrisman, 1997).
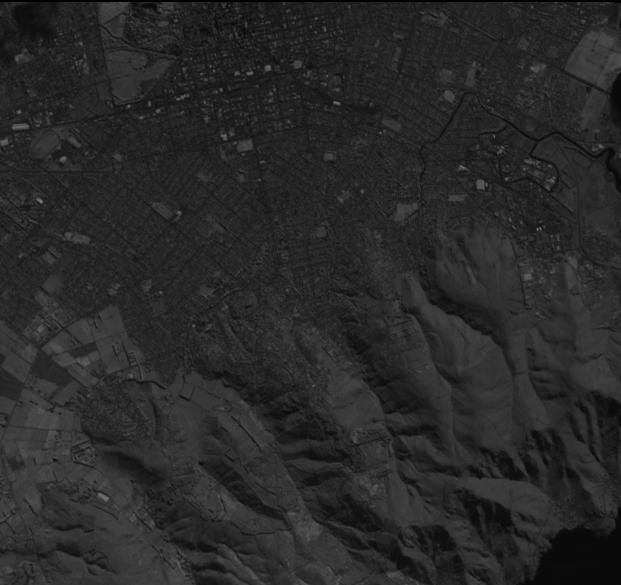
Below shows creation of Normalised Difference Vegetation Index (NDVI) from remote sensing images of the Christchurch area. The NDVI has the form (NIR-RED)/(NIR+RED) where NIR and RED represent reflectances recorded using energy in the red (620–750 nm) and near infrared (750 nm to 2500 nm) wavebands.
Remotely sensed images give reflectivity data, encoded as integer values from 0-255. This data can be used for areal classification, such as analysis of vegetation cover by measuring the ratios of different bands (Chrisman, 1997).
Below shows creation of Normalised Difference Vegetation Index (NDVI) from remote sensing images of the Christchurch area. The NDVI has the form (NIR-RED)/(NIR+RED) where NIR and RED represent reflectances recorded using energy in the red (620–750 nm) and near infrared (750 nm to 2500 nm) wavebands.
|
NDVI Macro
run("Image Calculator...", "image1=NIR operation=Subtract image2=RED create 32-bit"); rename("DIFF"); run("Image Calculator...", "image1=NIR operation=Add image2=RED create 32-bit"); rename("SUM"); run("Image Calculator...", "image1=DIFF operation=Divide image2=SUM create 32-bit"); rename("NDVI"); |
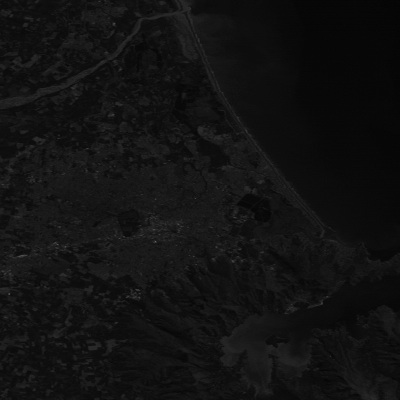
Red Waveband
|
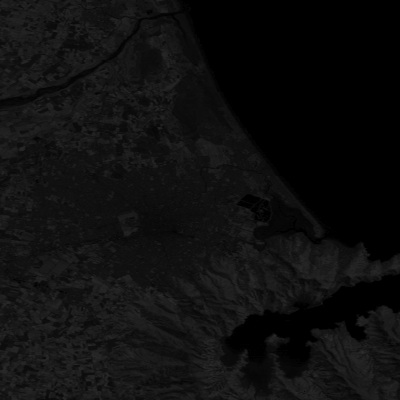
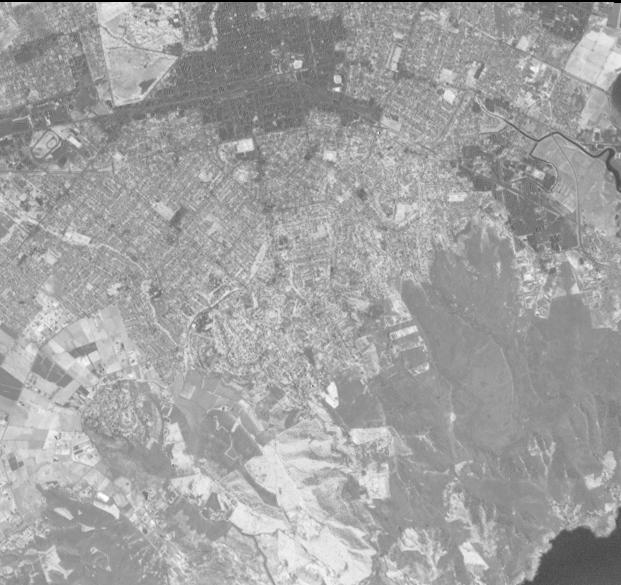
Near Infrared Waveband
|
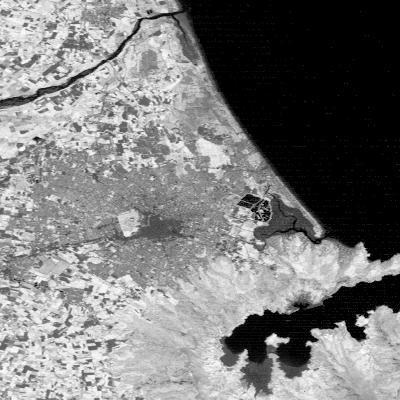
Normalised Difference Vegetation Index
|
Red Waveband
|
Near Infrared Waveband
|
Normalised Difference Vegetation Index
|
Density Slicing
I am able to create density slices that divide the images into coloured bands of different encoded value intervals. In these particular images the density slicing highlight areas of vegetation in the Christchurch area. This technique is often used in analysis of remote sensing imagery that appear to be uniform in tone, but are not (esri, 2012).
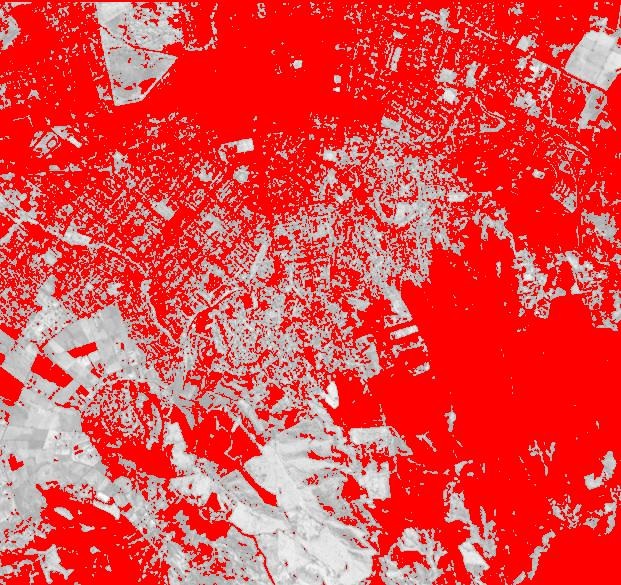
Red shows non-vegetated areas
|
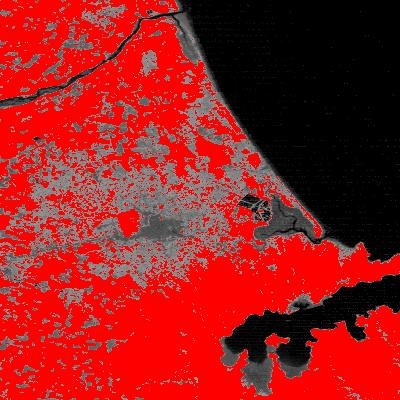
Red shows areas of vegetation
|
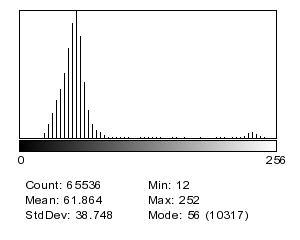
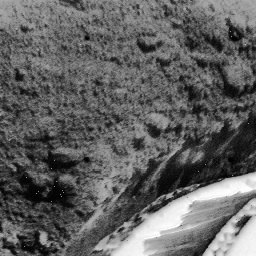
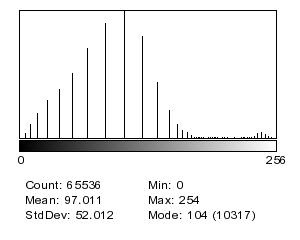
Image Stretching
The values of each image file are converted to display values shown on the histograms below. Using Look Up Tables adjustments can be made to these graphs using sliders to change effects such as brightness and colour. Enhancements can be made to the contrast using the Enhance Contrast dialog, two examples, Normalise and Equalise are shown below.
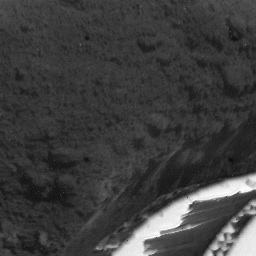
Original Image
|
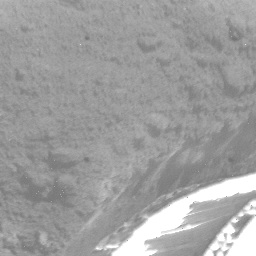
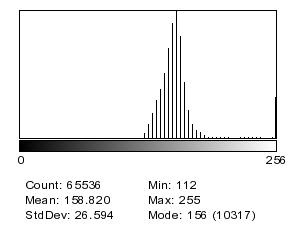
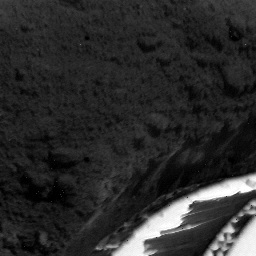
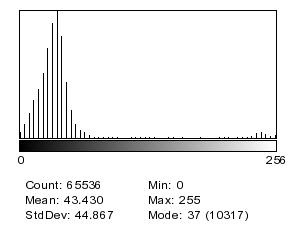
Brightness & colour adjustments
|
Normalised stretching
|
Equalised stretching
|
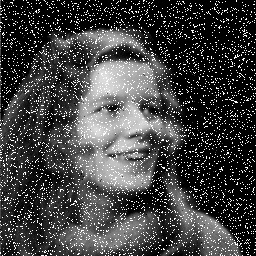
Image Filters
Use of different filter options to enhance the clarity of images and give different effects depending on image values.
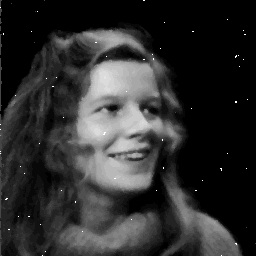
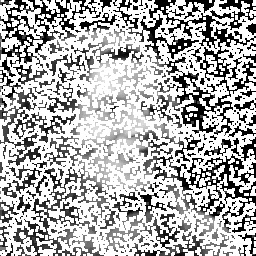
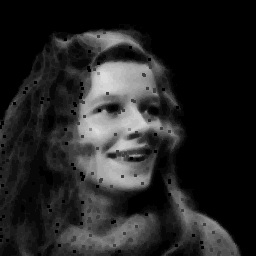
The image processing chain below shows the use of a median central tendency filter, this filter is most effective at removing noise from an image.
The image processing chain below shows the use of a median central tendency filter, this filter is most effective at removing noise from an image.
|
|
|
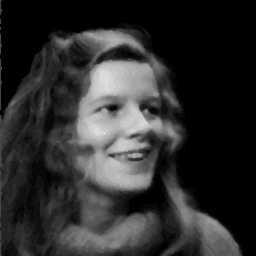
I am able to create macros detailing the image filtering process; here minor changes to the marco can be made to run for an alternative filter.
Below displays implementation of a mean central tendency filter, this filter is often used to smooth images by reducing the amount of intensity variation from one pixel to the next and to reduce noise.
Below displays implementation of a mean central tendency filter, this filter is often used to smooth images by reducing the amount of intensity variation from one pixel to the next and to reduce noise.
|
Macro
n=nImages; //number of images displayed selectImage(nImages); //use latest image for output run("Duplicate...", "title=Median"); run("Median...", "radius=1"); setLocation(n*300,100); //place window in line |
|

|
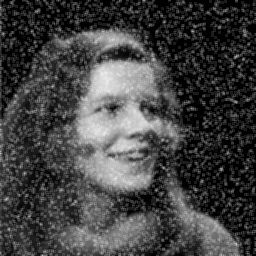
Use of maximum and minimum filters. The maximum filter spreads lighter areas at the expense of darker areas and the minimum filter spreads darker areas at the expense of lighter areas. These filters can be used at low levels to give a slightly out of focus effect.
Statistical Filter - Maximum
|
Statistical Filter - Minimum
|
